Power Analysis
Calculate the right sample size for your trial in three steps: pick a design, configure parameters, and view results.
Pick a Design
Choose from five trial designs. Each card shows an icon, name, and short description. Click a card to select it.
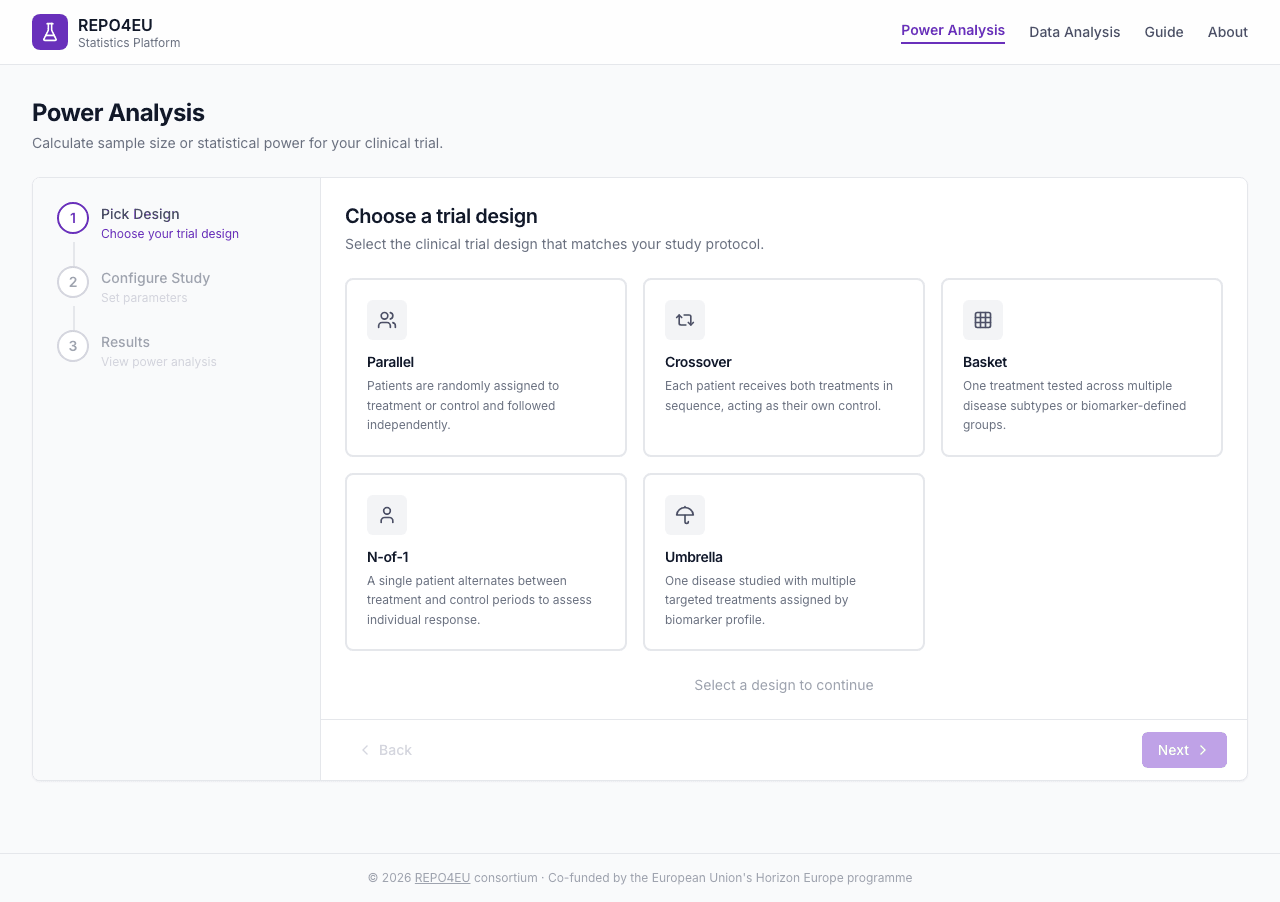
Five trial design cards - click one to select it.
After clicking a design, the selected card shows a purple border and checkmark badge. You can change your selection at any time.
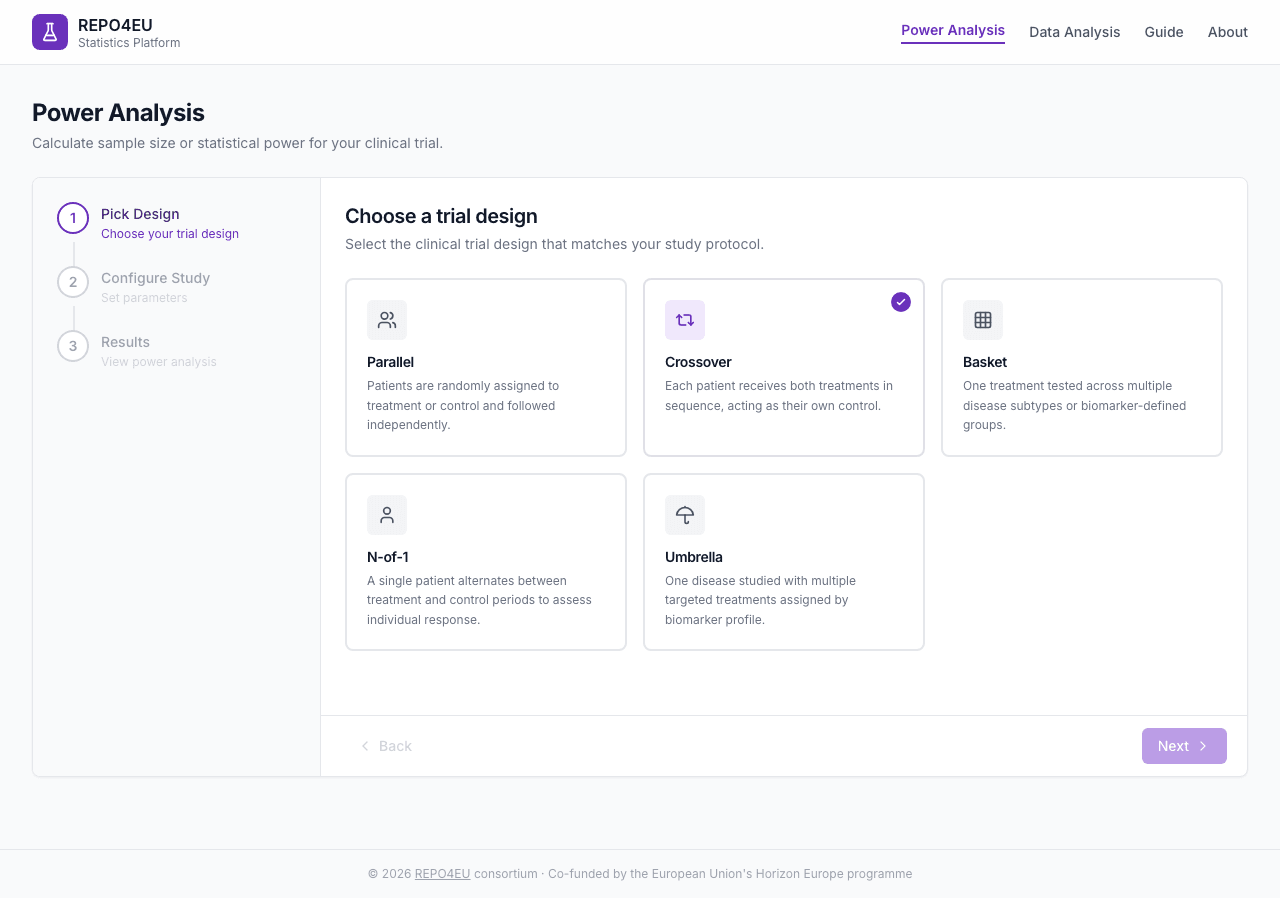
Crossover selected - purple border and checkmark badge confirm your choice.
Click Next to proceed to parameter configuration.
Configure Your Study
The form adapts to the selected design. All designs share general settings; design-specific fields appear below them.
General Settings
| Field | Description | Default |
|---|---|---|
| Primary endpoint | Continuous or Binary | Continuous |
| Task | Sample Size or Power | Sample Size |
| Method | Analytic or Simulation | Analytic |
| Significance level (α) | Type I error rate | 0.05 |
| Target power (1 − β) | Probability of detecting a real effect | 0.80 |
Design-Specific Parameters
- Mean difference - Expected difference between treatments
- Within-subject SD - Variability within the same patient
- Carryover effect - Yes/No toggle for carryover adjustment
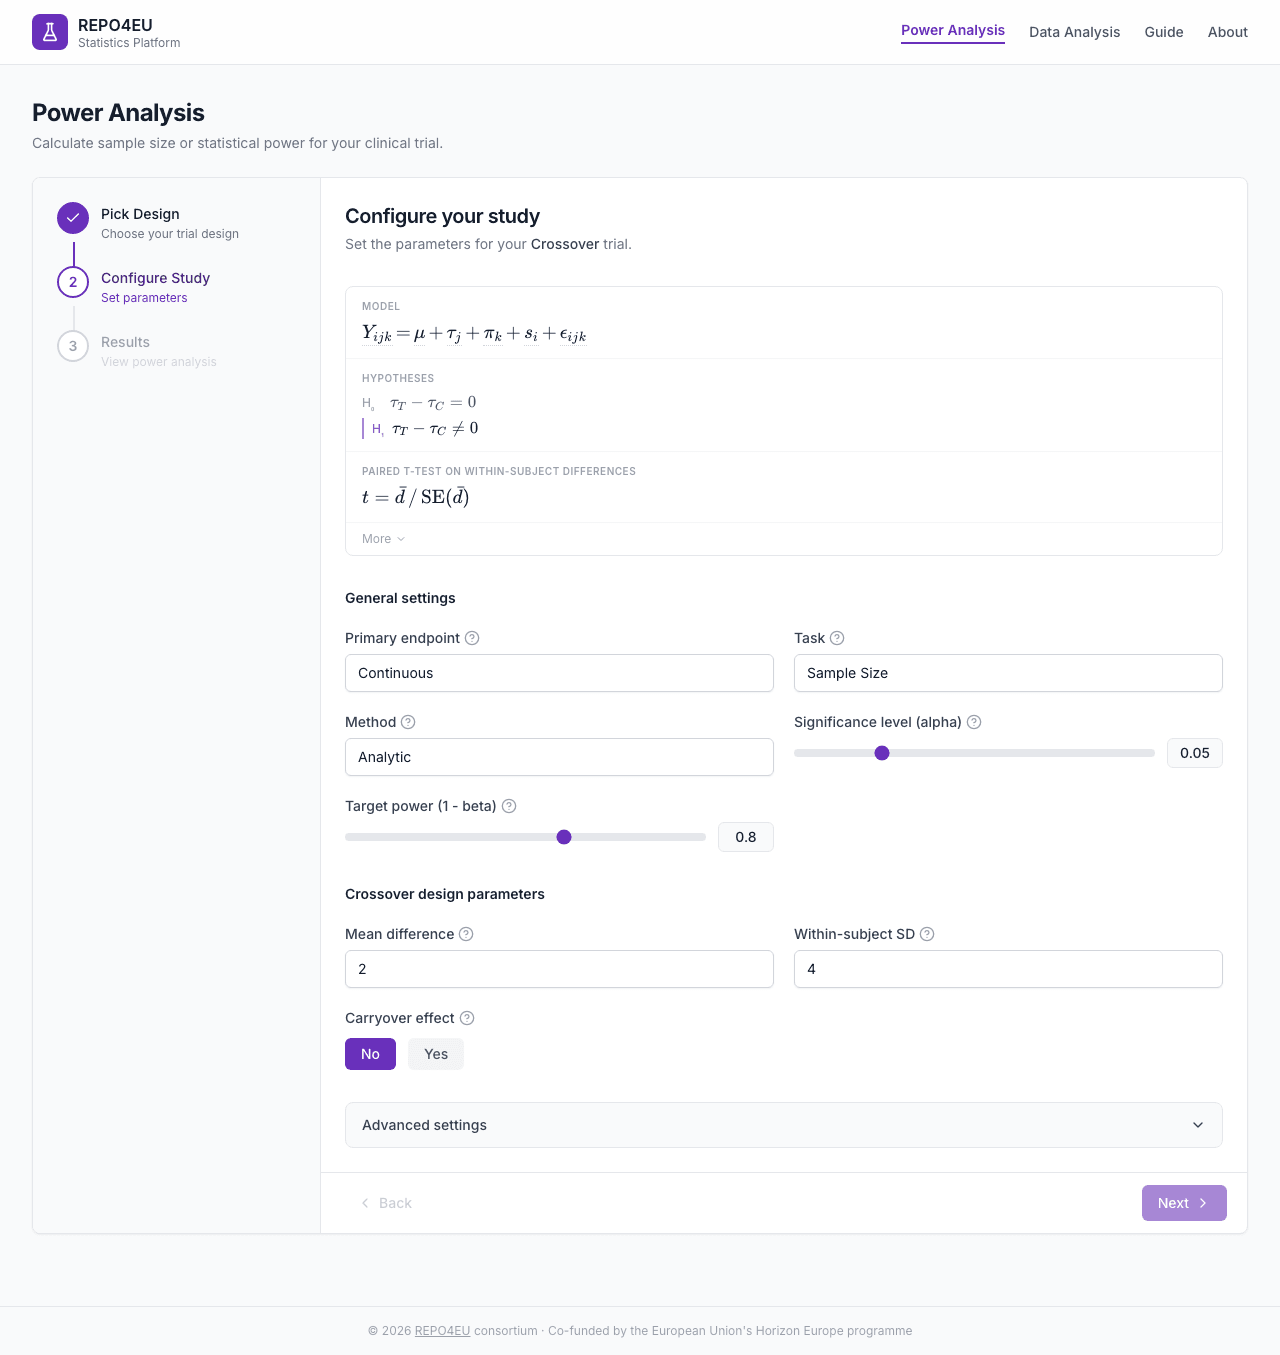
Default parameter values for crossover design.
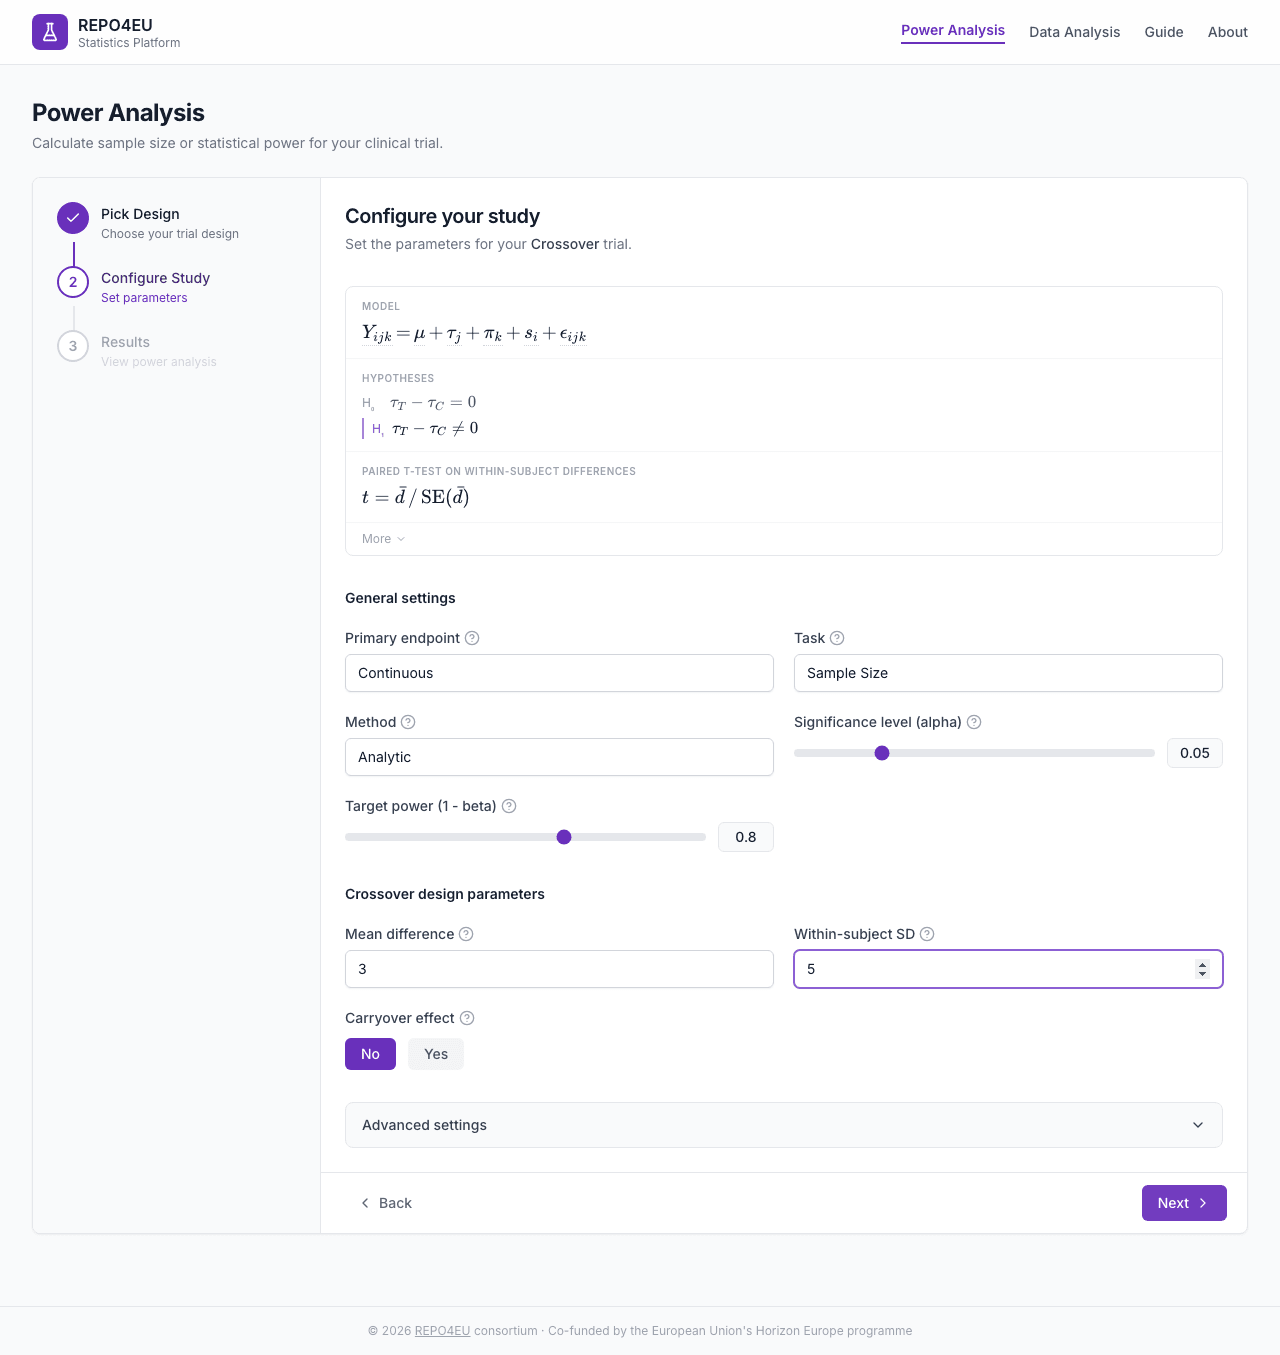
Configured parameters ready for calculation.
Advanced Settings
An expandable section at the bottom of the form contains additional options.
| Field | Description | Default |
|---|---|---|
| Dropout rate | Inflates the sample size | 0 |
| Number of simulations | For simulation method | 10000 |
| Random seed | For reproducibility | 42 |
Help system
Every field has a tooltip icon that shows a brief explanation on hover. Some fields also include a Learn more expandable panel with formula references and parameter recommendations.View Results
Clicking Next from step 2 triggers the power calculation via the API. A loading spinner shows while the computation runs.
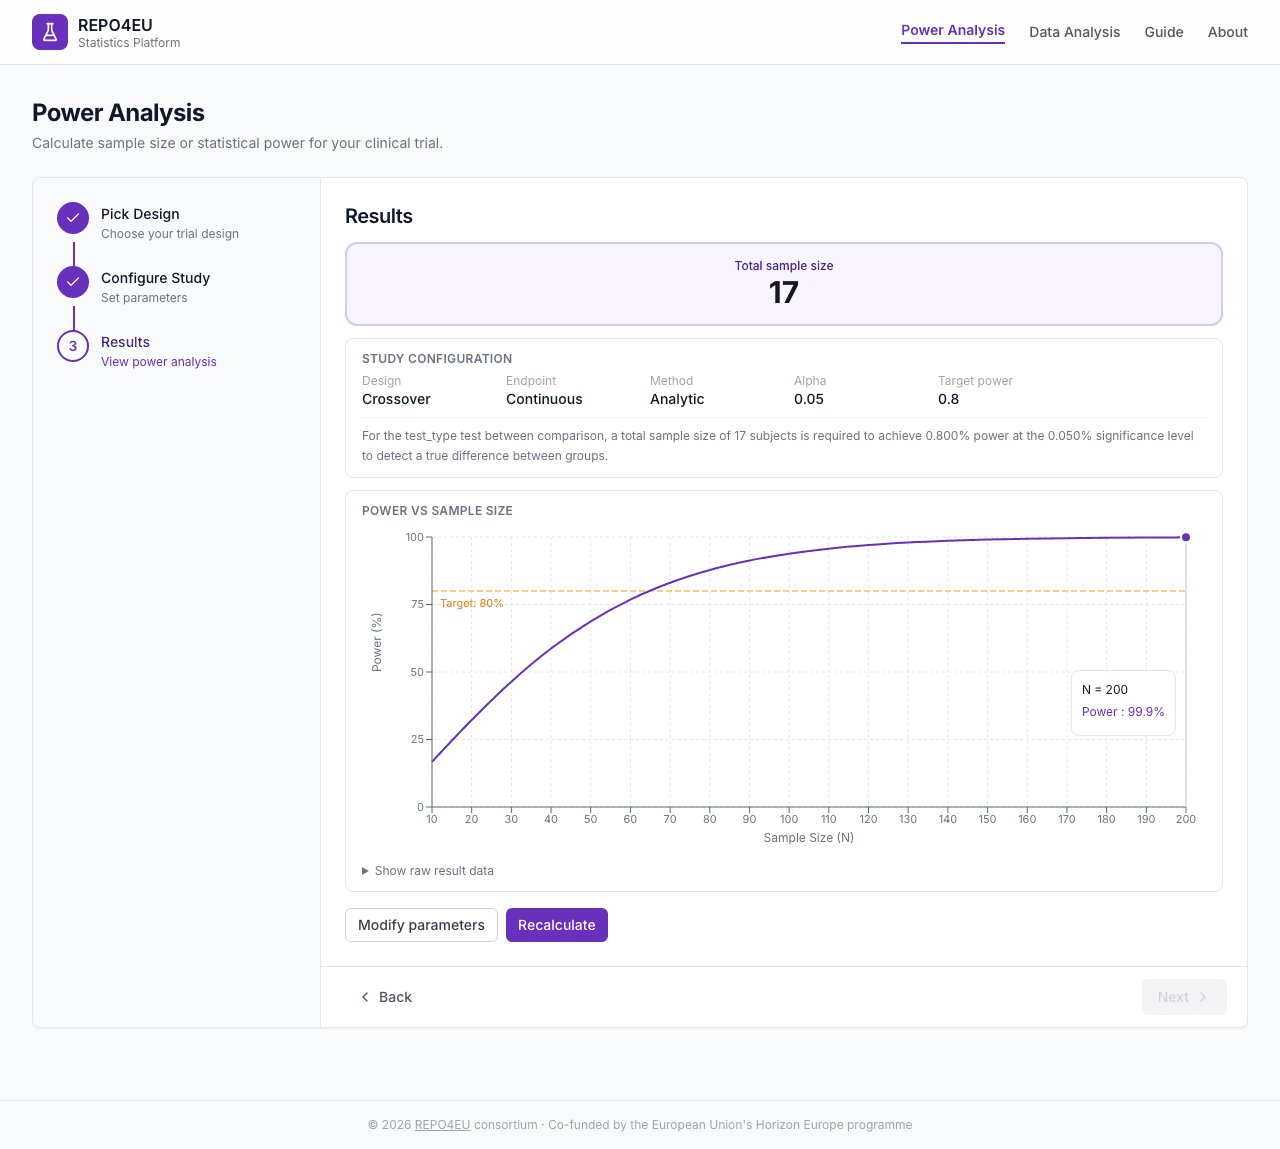
Power analysis results for a crossover design.
What you see
- Hero result box - The primary answer (total sample size or achieved power) in large text
- Study configuration - Summary of all parameters used
- Interpretation - Plain-language explanation of what the result means
- Parameter table - Raw result data from the API
- Action buttons -“Modify parameters” to go back, or “Recalculate” to re-run
Concepts
Trial Designs
Parallel
Patients are randomly assigned to treatment or control and followed independently.
Patients are randomly assigned to treatment or control and followed independently. The most common design for phase III trials.
Crossover
Each patient receives both treatments in sequence, separated by a washout period.
Each patient receives both treatments in sequence, acting as their own control. Requires fewer patients but assumes the treatment effect washes out between periods.
Basket
One treatment tested across multiple disease subtypes with statistical borrowing.
One treatment is tested across multiple disease subtypes or biomarker-defined groups (baskets). Bayesian borrowing methods can share information across baskets.
N-of-1
A single patient alternates between treatment and placebo across multiple periods.
A single patient alternates between treatment and placebo periods. Useful for rare diseases or personalized treatment decisions.
Umbrella
Patients assigned by biomarker, each subgroup receives a matched treatment.
Two variants: one shared control pool, or a substudy-specific control for each biomarker comparison.
Umbrella trials study one disease and assign patients to treatment arms by biomarker profile. Each biomarker group tests its matched targeted treatment against a control.
Choose the control strategy. Shared control uses one concurrent control arm for every biomarker subgroup; this can reduce the number of control patients, but the treatment comparisons become correlated. Substudy-specific control gives each biomarker subgroup its own control arm; use it when the control mean or rate, prognosis, or standard of care differs by subgroup.
The two strategies carry through to the analysis. A shared-control trial is fit as one model and each arm is compared to the common control; a substudy-specific trial is fit as a separate model per stratum (drug vs its own control). Either way, adjust for the many drug-vs-control comparisons. Dunnett correction is available only for shared-control designs; substudy-specific designs use Bonferroni, Holm, or no correction.
Endpoints
The platform supports continuous endpoints (e.g., blood pressure, FEV1) and binary endpoints (e.g., response/no-response, cure/no-cure). The endpoint type determines which statistical test and effect size measure are used for the power calculation.
Power Basics
Drag the sliders to see how alpha, effect size, and sample size shape statistical power.
Statistical power is the probability of detecting a real treatment effect if one exists. A power of 0.80 means an 80 % chance of finding a significant result when the treatment truly works. Higher power requires more patients. The significance level (α) controls the false-positive rate - typically set at 0.05.
Methods
Analytic methods use formulas for the selected endpoint and design. Simulation methods estimate power by repeatedly drawing virtual trials; use simulation when the calculator offers it and the assumptions sit outside a standard formula. For umbrella trials, this tool uses analytic calculations for both shared and substudy-specific controls. Shared-control calculations account for correlation among comparisons; substudy-specific calculations use separate treatment-control pairs.
Hypothesis Testing
Toggle between hypothesis types to see how rejection regions and power change.
Superiority tests whether the treatment is better than the control. Non-inferiority tests whether the treatment is no worse than the control by more than a specified margin. Equivalence tests whether the treatment and control are within a margin of each other. The choice affects sample size and how results are interpreted.